As an OS developer/hacker, I am recently hacking Raspberry Pi, including a project aiming at running XNU(macOS kernel) on Raspberry Pi 3 and the port of Embox to Raspberry Pi 2. I often feel disappointed, because it is hard to get some useful information from the commercially available off-the-shelf (COTS) boards when debugging a kernel. Specially, it means the Raspberry Pi here. Although the Raspberry Pi Linux, aka. Raspbian, is open-sourced at GitHub, the bootloader on the chip (or somebody would like to call it BIOS) is still close-sourced. But it can be configured by a config.txt file.
According to pinout Raspberry Pi JTAG, the GPIOs on the board can be configured through the config.txt to use some ALT functionalities, e.g., JTAG under ALT4 or ALT5. JTAG, or Joint Test Action Group, provides a standard interface (pin definition, etc.) to debug a program on a chip. I have some experiences back to 2019, using it to debug a real-time OS on an ARM development board. And it is widely used by many board/chip manufacturers, including RISC-V, ARM, etc. If it can work, that should be a perfect option for debugging using JTAG with OpenOCD.
Hardware
The Pin definitions for JTAG are as follows:

- ALT5 on GPIOs 4, 5, 6, 12 and 13
- ALT4 on GPIOs 22, 23, 24, 25, 26 and 27
In general, the Pins used are TMS, TDI, TDO, TCK, RTCK, TRST (not presented in ALT5). The Pin layout is not standard at all. So, I need to manually connect the Pins one by one to a standard JTAG debugger.
By searching the information, I found several standard JTAG interfaces (not all JTAG interfaces):
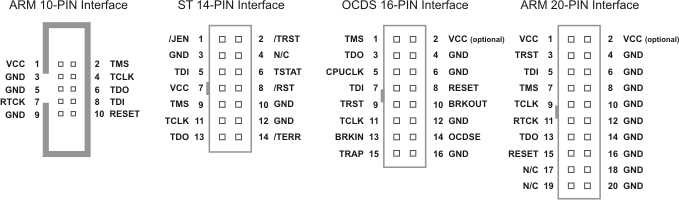
They do have TMS, TDI, TDO, TCK pins, which are common in JTAG. The TRST is the reset pin, so we can connect them to the pin marked as “Reset”. However, only ARM 10 pin and 20 pin contains a RTCK pin, I need to use a hardware debugger with one of the interfaces (I later realize that RTCK is a must).
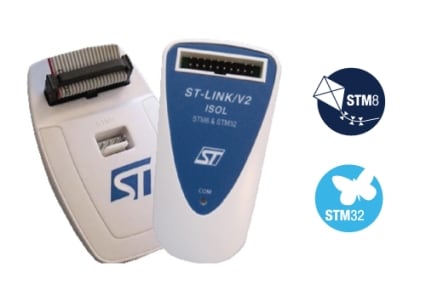
ST-Link v2
I firstly bought a ST-Link v2 debugger, which has a SWD interface and an ARM 20 pin interface.
It should work well. However, I finally found that my hardware might by buggy.
I tried to connect the ST-Link debugger from the official software, but both ~the software and~(I found that with the official software, it is necessary to connect the debugger for the first time to be able to connect) the OpenOCD 0.11.0 returns a wired status code during the initialization of JTAG stack through USB. The debug-level log information of OpenOCD is as follows:
1 | Debug: 222 311 stlink_usb.c:1125 stlink_usb_error_check(): unknown/unexpected STLINK status code 0x4 |
To know what happened, I tries to connect the Raspberry Pi from a JTAG debugger delivered with my first FPGA. Before that, I just validated that the debugger works well with the FPGA (in OpenOCD, using cpld/xilinx-xc6s.cfg target, which only uses TMS, TDI, TDO, TCK pins). With this debugger, OpenOCD can connect to the device: it does not report the USB bug anymore. However, it stops at complaining that RTCK signal cannot be responded.
So, it is the ST-Link work which does not work in my case. The hardware debugging is painful.
PS: The BCM2835 with ARM11 (Raspberry Pi 1, zero) does not seem to work with ST-Link High Level Abstraction(HLA), according to Ticket 280 of OpenOCD. But it might be possible with Direct DAP, which exists in ST-Link v2 later firmware and ST-Link 3.
FTDI FT232H
As I mentioned, this debugger is for my FPGA, which works fine out-of-box. The FT232H is a multi-function chip, can be configured as UART, FIFO, JTAG, I2C, SPI, etc. There seems to be an ARM 10 Pin interface. So, I connect it according to the layout of ARM 10 Pin.
I did not connect RTCK, so the OpenOCD returns an error. However, there is no datasheet for my hardware delivered with the FPGA. I think it may be caused by the not really connected RTCK pin, or by the complex configuration of the multi-purpose chip.
I just give up using this one, and try to follow the guide from an engineer at OpenSUSE, using a J-Link hardware.
J-Link
Realizing the the RTCK is important, I connected all the Pins to J-Link.
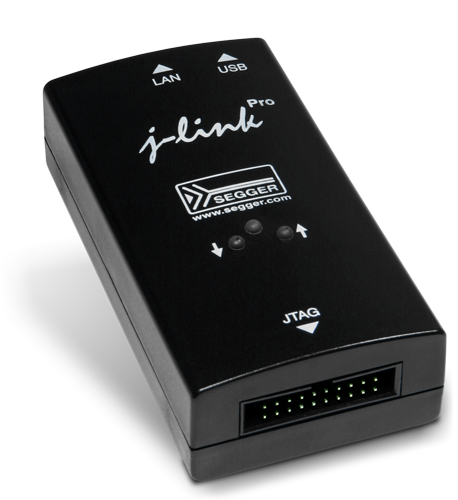
I use several jump wires to connect the irregular JTAG Pins on Raspberry Pi to the J-Link standard ARM 20 Pin tag. The connection is as follows:

Configurations
After setting up the hardwares, the configuration on Raspberry Pi is simple, just change the GPIO ALT to ALT4 and add:
1 | enable_jtag_gpio=1 |
to enable the JTAG debugging.
Software
The software is which I mentioned before, OpenOCD. It uses a tcl grammar to describe the debug target, the debug protocol (JTAG, SWIG, etc.) and other configurations. There are some pre-edited configuration files. They are located at /usr/share/openocd/scripts if you install OpenOCD from the software source. The basic usage to start a daemon is:
1 | openocd -f <debug-interface-conf> -f <debug-target-conf> -c <overwriten-or-appended-conf> ... |
Then we can connect to the daemon by telnet, or attach gdb to the established debug target(s).
Debug interface
The interface in OpenOCD describes how to connect to a hardware debugger. For J-Link, the default configuration is interface/j-link.cfg. The one for FT232H JTAG debugging is interface/ftdi/um232h.cfg, and interface/st-link.cfg for the ST-Link.
Debug protocol
The debug protocol is called transport in OpenOCD. Some possible values are:
1 | transport select jtag |
Raspberry Pi as a target
The OpenOCD project already contains Raspberry Pi platforms in its 0.11.0 version, such as:
1 | target/bcm2835.cfg # Raspberry 1, zero |
Error: unknown status
In a previous version of OpenOCD, e.g. the version in Ubuntu 20.04 LTS, the ARM core status for Hypervisor mode is not recognizable by the software. So when attaching gdb, there will be an error stating that the unknown status of the CPU, and will fail the gdb.
I then use the 0.11.0 version under Arch Linux, which works perfectly.
Conclusion
This post takes my painful experiences on debugging Raspberry Pi with JTAG. Fortunately, it finally works.
